For many, the taper is mysterious, rarely perfected, and tremendously elusive. But with progress in data and technology, we can now visualize that elusive beast, and the factors impacting your Performance Readiness™.
The Fitness, Stress and Readiness graph provides a visual representation of the hard work you’ve done and how ready you are to race at your best. Whether your goal is to set a new personal record, conquer a new distance, or qualify for a championship event, your best results will be realized not when your fitness is maximized, but when your fitness and training stress are optimized. In other words, you will perform well when you are properly tapered. The FSR™ graph provides unprecedented visibility into your race readiness so you can see when you are primed for greatness.
Let’s dive into the FSR graph and its elements.
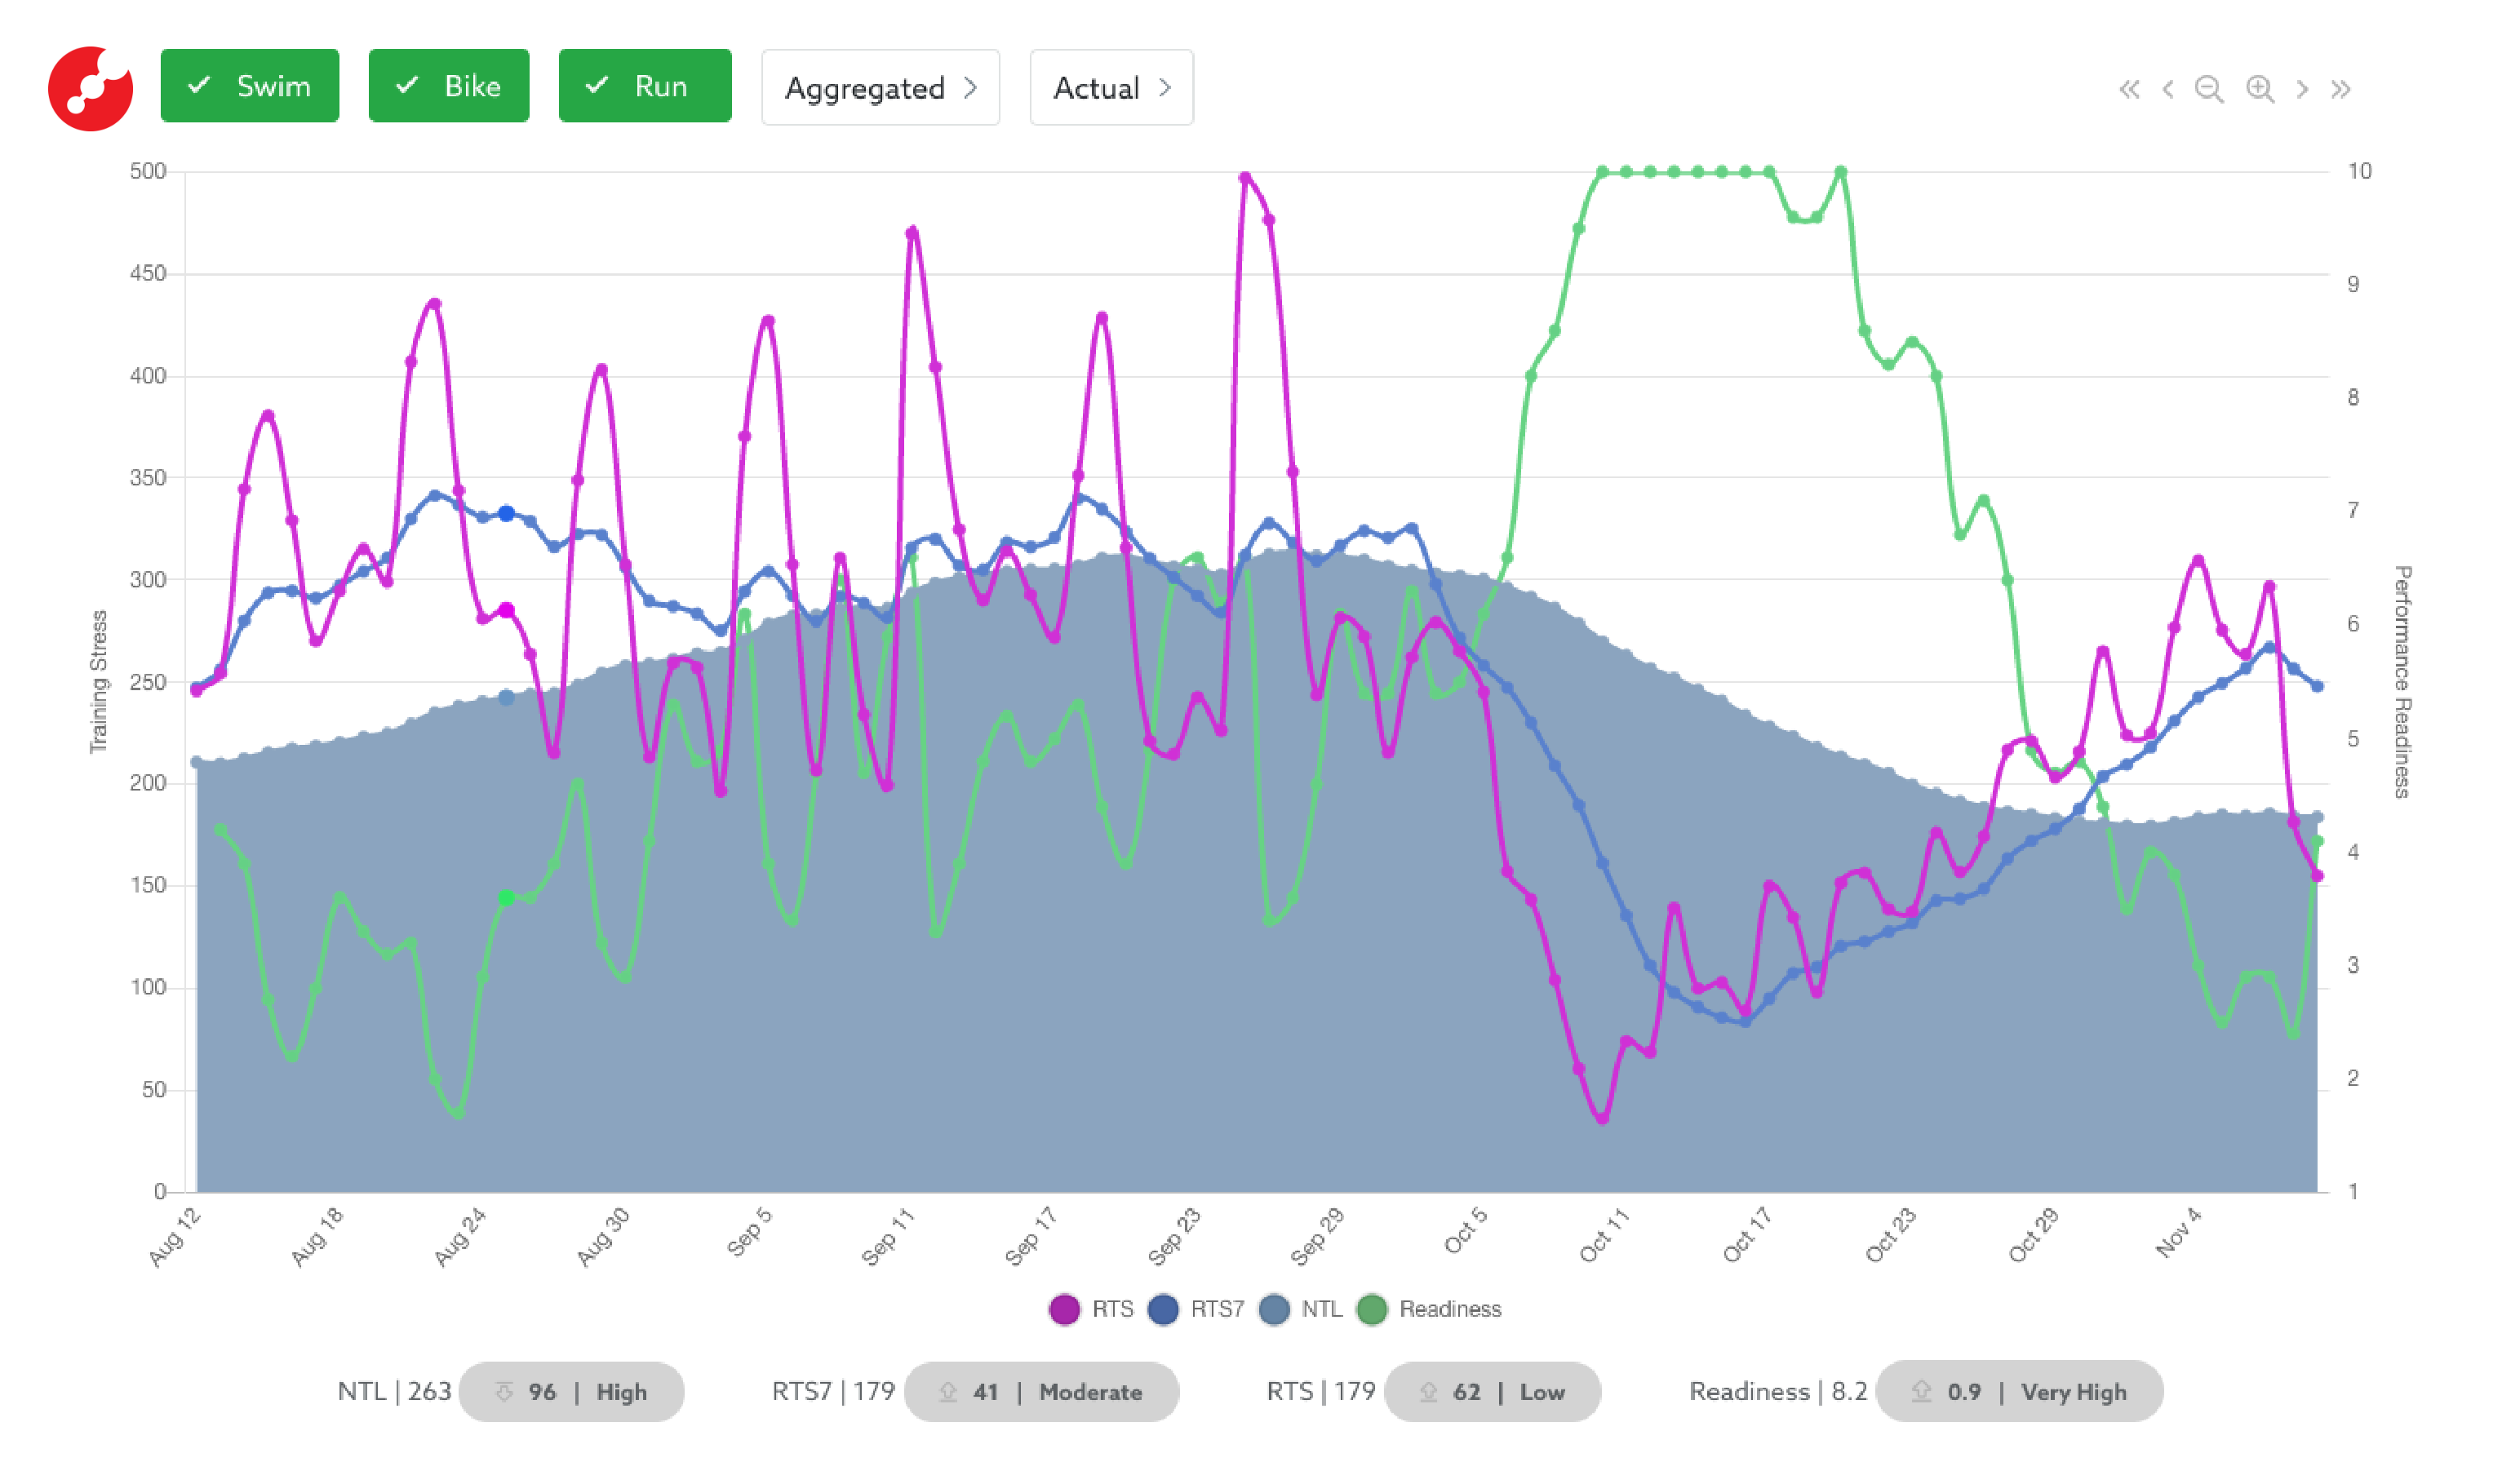
Figure 1. An example of an FSR graph.
Fitness
Your fitness is a measure of your past training load, with a particular emphasis on your recent sessions, and is represented within FSR as your Normalized Training Load™(NTL™). See Figure 1. Your training load must be high enough to allow you to safely complete the training necessary to improve your performance ability, but unnecessarily increasing your training load or maintaining an unnecessarily high training load can come at the expense of performance gains and increased injury risk. Maximizing fitness should not be your primary goal because it could lead to overtraining (which some like to refer to as “under-recovery"), injury, or even health issues like RED-S. Also, reaching for high levels of fitness often leaves athletes mentally and physically fatigued which negatively impacts performance. Remember, fitness is your ability to train and should not be confused with your ability to perform on race day.
Training Stress
Training stress is the stimulus applied to the body in training to produce specifically desired adaptations to improve performance, including improving functional threshold, increasing stamina, or promoting active recovery. Stress is produced in every training session, but the lingering effects can last well beyond that session or the day of that session. Residual Training Stress™ (RTS™) is a metric used to quantify not only the amount of stress from a session, but also the time necessary for the body to recover from the training stress and realize performance adaptations. RTS is the primary contributor to your NTL as well as other Optimized Training™ metrics.
As previously mentioned, your best results will be realized not when your fitness is maximized, rather when your fitness and training stress are optimized. Great results on race day do not come from simply having the ability to sustain a training load or just accumulating training stress. Your best results will come when your training load is paired with proper recovery so that your body can fully adapt from training and you can race in peak form.
Performance Readiness
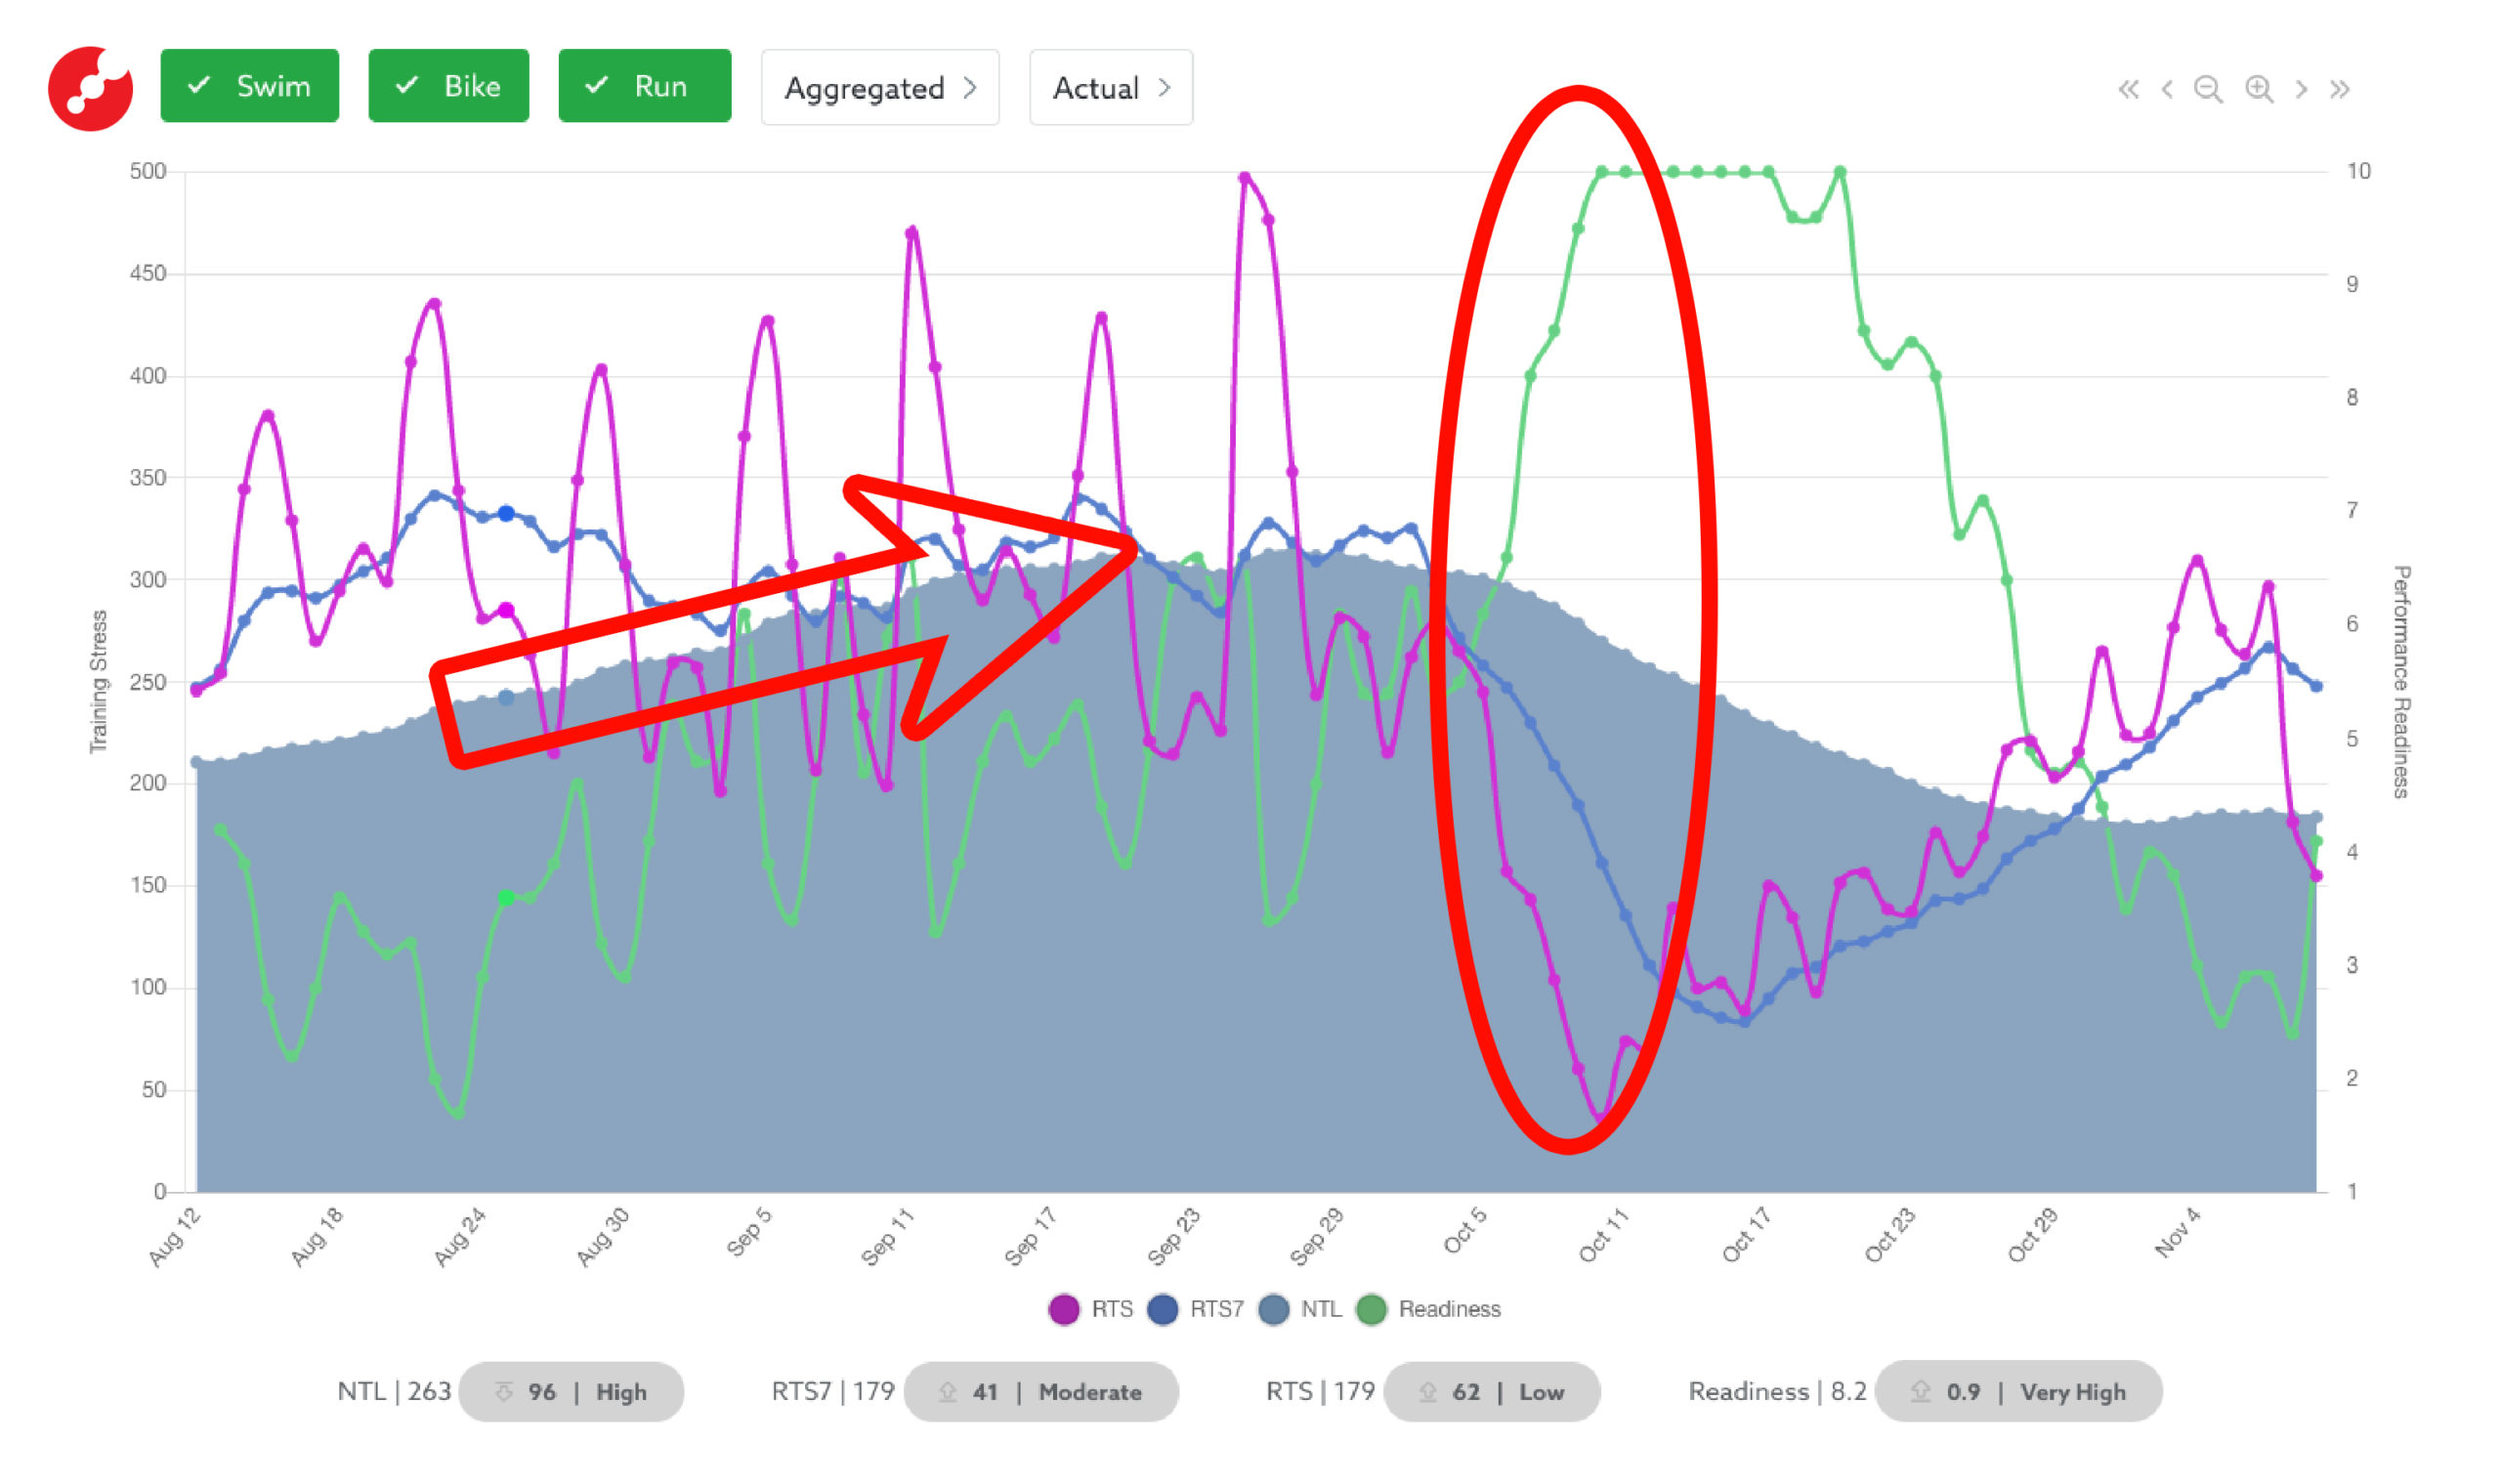
Figure 2. The arrow highlights nicely building Fitness (NTL) during the athlete's Build phase. The oval is around the taper where Fitness gradually falls, Training Stress (RTS) rapidly falls, and Readiness rapidly increases.
Performance Readiness is a metric that describes your state of recovery and ability to perform. Your readiness is derived from NTL and RTS among other factors and is represented on the FSR chart on a 1-10 scale, with a 10 being your most ready to perform in either your next training session or on race day. Your training should seek to gradually build fitness and then taper your training leading into race day so that your fatigue level falls faster than your fitness does, thereby improving your performance readiness. That approach will lead to a strong Performance Readiness score between 8 and 10 and a higher chance at nailing your best race of the season (or life!).
Precisely optimizing fitness, stress, and readiness is critical to maximizing your performance potential, but so much goes into this equation it is practically impossible to manage yourself. Training with a load or stress level too low and you will never realize your full potential. Too little recovery and the you will overtrain, experience an increased risk of injury, and will underperform on race day. Use the Fitness, Stress, and Readiness graph for ultimate visibility into your training and race readiness. Then execute with confidence on race day!
This educational article is brought to you by RaceX, the Official Race Execution App of USA Triathlon. Download for free here so you can nail your pacing, nutrition and more at your next triathlon. If you’d like to create your own FSR chart, visit TriDot.com to start your free trial today.